Current Lightning Map
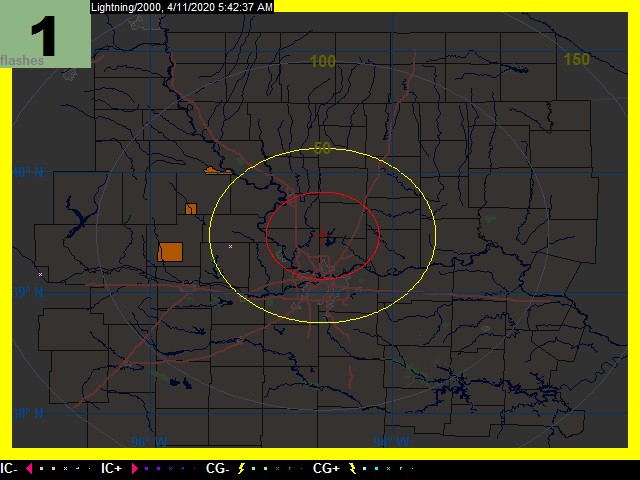
The box in the upper left hand corner of the map indicates the number of lightning strokes that occurred in the last minute before this image was uploaded.
Currently the image is being uploaded every 5 minutes. This time will decrease when storms are in the area and increase on calm days.
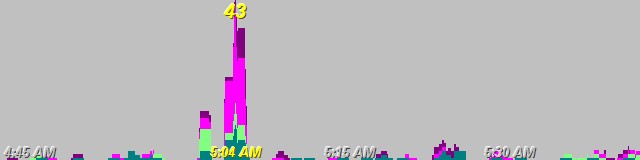
The image below is a graph of the lightning rate for the last two hours.
For current summary of what is happening click here for the NOWCast.
For the daily summary click here.
To go back to my main weather page click here.

Please note that this data is provided for your and my enjoyment only.
DO NOT use the information provided here for the protection of life or property.
If you see lightning or hear thunder take immediate precautions!